
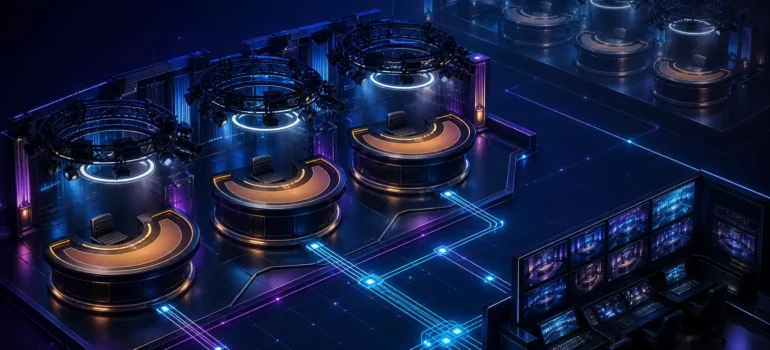
Digital content scales by copy: a new slot costs a certification fee and a server allocation, then serves unlimited concurrent players. Live scales by headcount. Every additional table is another streaming position requiring a trained dealer, a supervisor, a rotation schedule, and a redundancy path — for every hour the table is live, across every shift, every weekend, and every holiday of the year. That single distinction explains why operators with large slot catalogues frequently underestimate live infrastructure, and why the winners in live formats are the providers whose live studio operations are engineered rather than improvised. This analysis works through the four levers that determine live capacity: scheduling, table scaling, uptime engineering, and unit economics. It extends DYG Games’ live and fish-format portfolio into the operational layer.

Why Live Is an Operations Business First
Three structural facts separate live from RNG formats and dictate every operational decision that follows.
- Labour is the product. In slots, marginal cost trends to zero. In live , marginal cost per concurrent table-hour is dominated by wages, so profitability is a scheduling outcome rather than a content outcome.
- Capacity cannot be inventoried. An unsold table-hour is not stock that can be sold tomorrow. It is lost permanently. Conversely, an understaffed peak hour is a hard ceiling on revenue that no marketing spend can lift.
- Uptime is visible. A slot that fails to load is a technical fault. A live stream that freezes during a high-value baccarat hand is a trust event witnessed by players, with consequences for retention that persist far longer than the outage itself.
The operational objective therefore reduces to a single sentence: match staffed capacity to demand across a 24/7 calendar, at the highest sustainable utilisation, with redundancy that keeps the SLA intact when something breaks. Everything below serves that sentence.
Dealer Scheduling: The Mathematics of Coverage
Coverage is where live costs are won or lost. A table that must be live 24 hours a day, 365 days a year represents 8,760 table-hours annually. Covering those hours with eight-hour shifts requires a minimum of 1,095 dealer-shifts per year — but a minimum is not a plan. Real coverage requires a coverage factor that absorbs breaks, absence, training, and attrition.
The coverage factor
A practical formula used in studio planning is:
FTE per live seat = base shifts per day × (1 + absence rate + training allocation + attrition buffer)
Under illustrative assumptions — 3 base shifts per day for 24/7 coverage, an absence rate of 12% including statutory leave and sick days, 8% allocation for mandatory training and certification renewal, and a 15% buffer for attrition and ramp-up of new hires — the coverage factor lands at approximately 1.35, producing roughly 4.05 dealers per seat across all live hours. In practice, studios plan between 4.0 and 4.5 dealers per 24/7 seat once language specialisation and peak-shift concentration are included, because peak demand is not evenly distributed across the clock.
Demand-shaped rostering
| Demand band | Typical pattern | Staffing response |
|---|---|---|
| Off-peak | Low concurrency; tables idle for long intervals | Consolidate onto fewer tables; staggering to protect dealer earned hours; use the window for training rotations |
| Shoulder | Rising concurrency; mixed game preference | Open secondary tables in the highest-conversion formats; activate flex-pool dealers on short notice |
| Peak | Evening and weekend concentration; VIP demand | Full table coverage plus dedicated high-limit positions with senior dealers; no maintenance windows permitted |
| Event spikes | Promotional tournaments, holiday periods, major sporting calendars | Pre-rostered surge coverage; cross-trained dealers from adjacent formats |
Utilisation, not headcount, is the KPI
Dealer utilisation — live table time as a share of paid hours — is the metric that determines whether a studio is efficient. Mandatory breaks, rotation limits, and compliance requirements make 100% impossible; a well-run studio targets roughly 70% to 80% of paid dealer hours on live tables, with the remainder allocated to statutory breaks, briefing, and training. Studios that run below 60% are carrying idle labour; studios that push above 85% trend toward errors, higher attrition, and rule breaches, which cost far more than the labour they save.
Two scheduling constraints are routinely underestimated. First, language-qualified dealer pools cannot be freely pooled across markets: a native-speaker dealer for a German-language table cannot cover a Japanese-language table, which means coverage factors must be calculated per language pod, not for the studio in aggregate. Second, rotation limits cap continuous live dealing at roughly 90 minutes before a rotation, which effectively increases the number of dealers needed per seat during peak hours by creating non-productive intervals that cannot be filled with table work.
Table Scaling: From Launch Pod to Multi-Studio Network
Tables should be added in stages, each gated by evidence, because each stage changes the cost structure and the operational complexity profile.
| Stage | Scale | Staffing profile | Gating criterion to advance |
|---|---|---|---|
| 1. Launch pod | 4–8 tables, one studio, one primary language | 20–40 dealers, single shift lead per shift | Sustained utilisation above 60% at peak for two consecutive months |
| 2. Format expansion | 12–20 tables across roulette, baccarat, blackjack, dedicated VIP | 60–100 dealers; format-specific certification tracks | VIP table demand exceeding capacity; measurable cross-format play from slot and fish-game players |
| 3. Language and market pods | 20–40 tables, multiple language pods, second studio | 130–200 dealers; per-pod supervision and QA | Regulatory certification complete in each target market; single-site resilience tested against a simulated outage |
| 4. Multi-studio network | 40+ tables, follow-the-sun staffing, N+1 studio topology | 250+ dealers across sites; centralised workforce planning | Continuous improvement in cost per table-hour as volume grows |
The gating logic matters more than the numbers. Adding tables before peak utilisation justifies it converts variable cost into structural cost, because dealer headcount and studio floorspace are both committed in advance of demand. The correct sequence is utilisation first, capacity second.
SLA Targets and Uptime Engineering
For live , service-level definitions should be written in operational terms that a studio manager can control, and every one of them should be tested under load rather than in a lab.
| SLA dimension | Illustrative target | Operational mechanism |
|---|---|---|
| Table availability | 99.9% measured monthly per table during scheduled live hours | Dual encoder paths, redundant ISP circuits, proactive stream health monitoring |
| Glass-to-glass latency | Sub-second under normal conditions, with a defined ceiling | Regional edge delivery, adaptive bitrate ladders, latency-budget ownership per component |
| Session reconnect | Player rejoins the correct table and seat without losing bet state | Server-side seat and bet-state persistence independent of the video stream |
| Failover time (RTO) | Seconds to low minutes, automatically initiated | Warm-standby tables in a second studio; automated routing on health-check failure |
| Bet integrity (RPO) | Zero tolerance for lost or duplicated wagers | Synchronous ledger writes with game-round reconciliation and audit logging |
| Dealer handover | No dropped rounds at rotation | Rotation scheduled between rounds, not during; dual-dealer overlap on high-limit tables |
Uptime in live is a compound metric rather than a single percentage. A table can be technically online while being commercially unusable — freeze-heavy, high-latency, or audio-degraded. Effective live casino uptime management therefore tracks usable table-hours: time in which the stream was stable, the audio was clean, the dealer was present, and the round cycle was within the expected cadence. Studios that report on availability alone consistently overstate their real service level, and operators who contract against availability alone consistently under-protect themselves.
Multi-Studio Redundancy and Failover
A single studio is a single point of failure for a 24/7 product. Multi-studio topology is what converts an infrastructure incident into an operational blip.
- N+1 studio design: capacity to absorb the full live table count of a failed site, at least for peak formats. The spare capacity does not need to be dedicated — it can be warm-standby tables that are staffed during peak and idle off-peak.
- Warm-standby tables: physically equipped and pre-certified tables in the secondary studio, with dealer pools trained on the same game rules and the same user interface, so that routing a player to the standby table is invisible rather than jarring.
- Automated health-check routing: failover should trigger from objective signals — stream health, encoding continuity, round-cycle timing, dealer presence detection — not from a human noticing a problem.
- Ledger independence: video can fail over in seconds, but betting state cannot be allowed to fail at all. The round ledger must be authoritative, replicated, and reconciled against the stream, so that failover never creates an ambiguity about whether a wager was placed.
- Geographic separation: the secondary studio should be on distinct power, network, and ideally regional infrastructure, so that a single utility or carrier event cannot take both sites down simultaneously.
The practical test of redundancy is not documentation — it is a scheduled, unannounced failover drill during a live peak window, measured against the SLA table above. A failover path that has never been executed under real betting load is a plan, not a capability.
Cost per Table-Hour: The Unit Economics of Scale
Every live decision ultimately resolves into one number: cost per table-hour. It is the studio equivalent of cost per acquisition, and it is the number that determines whether a flat monthly table fee is profitable for the provider and fair for the operator. The build-up below is illustrative and assumption-based, intended as a modelling template rather than a market quotation.
| Cost component | Illustrative basis | Cost per staffed table-hour |
|---|---|---|
| Dealer labour (fully loaded) | €22 per paid hour × 1.35 coverage factor | €29.70 |
| Floor supervision | 1 supervisor per 4 tables at €35 loaded hourly, coverage factor applied | €11.80 |
| Studio overhead | Floorspace, power, cooling, security, amortised equipment | €8.00 |
| Streaming and platform stack | Encoding, edge delivery, dual-path bandwidth, monitoring | €4.50 |
| Compliance and QA | Surveillance review, table audits, jurisdictional reporting | €2.50 |
| Total illustrative cost per table-hour | Mid-tier table, single studio, present scale | €56.50 |
Break-even occupancy
The cost above is payable whether or not players arrive, which makes occupancy the critical variable. Using an illustrative assumption of €310 GGR per active table-hour for a mid-tier table, the break-even utilisation is:
€56.50 ÷ €310 ≈ 18% utilisation
In other words, beyond approximately one-fifth occupancy, each additional active table-hour is strongly accretive. At 60% utilisation the same table produces roughly €186 of GGR per staffed table-hour, against €56.50 of cost — a gross contribution margin near 70% before regulatory duties and platform fees. This is why studio operators prioritise utilisation ruthlessly, and why table scalability is a demand-matching exercise rather than a supply-expansion exercise. Adding a table that sits at 10% occupancy destroys value; filling an existing table from 45% to 65% creates it at almost no incremental cost. The same margin logic that governs portfolio allocation in digital content applies here in physical form.
Case Pattern: Scaling from 8 to 48 Tables
Consider an illustrative composite deployment: a provider launching live formats with eight tables in a single studio and scaling to 48 tables across two sites over eighteen months. The sequence, and the problems encountered, follow a consistent pattern.
In the launch phase, the studio carried roughly 38 dealers covering a 20-hour live window in one language, with two roulette tables, two baccarat tables, and four blackjack tables. Peak utilisation quickly reached the 70% range on baccarat while roulette sat near 30%, revealing the first operational lesson: demand concentrates by format, not by table count. The initial response was to convert one roulette position to baccarat rather than add a new table — a capacity reallocation with no headcount increase, which lifted studio-level utilisation by a meaningful margin at zero incremental labour cost.
The second phase added language pods, which proved to be the most demanding staffing constraint in the entire deployment. Language-qualified dealers could not be pooled across pods, so coverage factors had to be calculated per language even though the tables shared a floor. Introducing a second language required a dedicated dealer pool of a size that only made sense above a threshold of concurrent tables — a clear illustration of why language expansion should follow utilisation proof rather than precede it. During this phase, the studio also introduced a flex pool of cross-trained part-time dealers, rostered on short notice, specifically to absorb event spikes without permanently inflating the coverage factor.
The third phase opened a second studio, not for capacity but for resilience, with warm-standby tables for the highest-revenue formats and automated routing triggered by stream health checks. The most valuable outcome of this phase was not a metrics improvement but a stress test: a scheduled failover drill conducted during a peak evening window, with live wagers on the tables. The failure mode discovered was not in the video path — which failed over cleanly — but in the round ledger handoff, where a partial reconciliation delay briefly created ambiguity about settled wagers. Fixing that required making the ledger authoritative and independently replicated, decoupling it from the streaming infrastructure entirely. No availability dashboard would ever have surfaced that risk.
By the end of eighteen months, the network carried 48 tables across two studios, roughly 260 dealers, and a cost per table-hour that had declined as volume grew — because studio overhead, compliance, and management layers were amortised across a larger table base while scheduling discipline kept utilisation in the target band. The scaling path was not a straight line of table additions; it was a sequence of utilisation improvements, format reallocations, staffing-model changes, and one resilience architecture decision that could not have been deferred.
Frequently Asked Questions
How many dealers do we need per live table?
For 24/7 coverage, plan on approximately 4.0 to 4.5 dealers per table, derived from the base shift requirement multiplied by a coverage factor of roughly 1.35 to 1.45 for breaks, absence, training, and attrition. That figure rises further when a table is language-restricted, because dealer pools cannot be shared across languages. Tables live less than 24 hours a day, or concentrated in peak windows, require proportionally fewer dealers per seat but a larger flex pool.
What is a realistic uptime SLA for live casino tables?
99.9% measured monthly per table during scheduled live hours is a realistic and defensible target that still allows for genuine maintenance and incident recovery. Contracting above 99.9% requires redundancy at every layer — dual encoders, redundant bandwidth, and a staffed standby studio — and should carry correspondingly higher commercial terms. Whatever the headline number, the SLA should be defined against usable table-hours rather than simple availability, or it will not reflect what players actually experience.
Should we build our own studio or license live content?
Building a studio converts content cost into an operations business with substantial fixed cost, hiring requirements, regulatory obligations, and physical infrastructure. It becomes rational at a scale where your own utilisation can sustain the coverage factor — in practice, when you can commit to a table count that keeps average utilisation comfortably above break-even. Below that threshold, licensing from a provider with established multi-studio redundancy delivers better unit economics and dramatically lower operational risk. Many operators run a hybrid: licensed core formats plus a small proprietary studio for differentiated or market-localised tables.
How do we handle peak demand without overstaffing?
Three mechanisms work together. First, demand forecasting by format and by hour allows rosters to be shaped rather than flat across the clock. Second, a flex pool of cross-trained part-time dealers absorbs spikes without inflating the permanent coverage factor. Third, capacity can be reallocated between formats on the studio floor — converting a low-utilisation roulette position into a high-demand baccarat or blackjack table often solves a peak problem with no headcount change at all.
What is the biggest cause of live casino revenue leakage?
Idle capacity during peak hours. It is the one failure that cannot be recovered: a player who cannot find a seat at a baccarat table during the evening peak does not simply wait — they leave, and some proportion never returns to the live lobby. This is why the operational KPI hierarchy should place utilisation and peak concurrency above headcount efficiency, and why table additions should be driven by sustained high utilisation rather than by catalogue ambition.
How does table scalability affect commercial negotiations?
Directly, because cost per table-hour is the provider’s floor for any fixed or hybrid table pricing, just as it is the operator’s benchmark for what a licensed table should cost. Operators who model their own floor-level economics — expected GGR per active table-hour, expected utilisation, and the SLA standard they require — negotiate from evidence rather than from a quoted rate list. Providers who can demonstrate declining cost per table-hour as volume grows are also demonstrating real operating leverage, which is a legitimate reason to prefer them at scale.
How quickly can a new live table be added?
Technically, a table can be equipped in weeks. Operationally, the constraint is people: recruiting, training, certifying, and rotating dealers to the point where a new table can be staffed across all live hours with achievable utilisation typically takes considerably longer, and language-specific requirements extend it further. Planning should therefore start from the hiring and training pipeline rather than from the hardware. A table that exists but cannot be staffed is a fixed cost with no revenue attached.
Conclusion: Engineer the Studio, Then Scale It
Live casino studio operations reward the same discipline that governs the rest of iGaming: model the unit economics, measure the metrics that drive decisions, and scale only against evidence. Scheduling that respects the coverage factor protects margin. Table scaling gated on utilisation protects capital. Uptime engineering defined against usable table-hours protects trust and retention. Multi-studio redundancy protects the continuity of a product that players expect to be available every hour of every day. Table scalability is not a matter of how many tables you can build — it is a matter of how many tables you can staff, fill, and keep live at a cost per table-hour that still leaves room for profit.
Planning live capacity for your next market or launch? DYG Games delivers live-format and fish-game content supported by studio operations designed for 24/7 coverage, transparent table-hour economics, and SLA terms written in the operational language your procurement team actually evaluates. Review our latest operational and market analysis in the DYG Games newsroom, or contact our team to model capacity, coverage, and cost per table-hour against your projected demand.